Last updated: 2026-07-20
Market size, structure, and economics
How big is AM in 2025–2026?
❓ How large is the industry, and why do published numbers disagree?
There is no single official global statistical series for “all additive manufacturing.” Analyst houses define different perimeters:
- Hardware only vs hardware + materials + software + services.
- Industrial systems vs including desktop/prosumer.
- Polymer + metal vs metal-only cuts.
Directional picture as of mid-2026 from secondary reporting of primary industry trackers (treat ranges as scope-dependent, not measurement error alone):
| Source (as reported in trade/secondary coverage) | Figure | Notes |
|---|---|---|
| Wohlers Report 2026 (trade citations) | Global AM ~$24.2B in 2025, ~+10.9% YoY | Full ecosystem framing; services emphasized as maturity signal |
| AMT-style estimates (trade citations) | ~$12.5B in 2025 → ~$20B by 2030 | Narrower perimeter examples exist in circulation |
| MarketsandMarkets (trade citations) | ~$16.4B in 2026 → ~$31.8B by 2032, ~11–12% CAGR | Forecast band; automotive often cited as large end market |
| AM Research Q1 2026 (trade citations) | Polymer + metal ~$4.35B in Q1 2026, +13.1% YoY | Quarterly production-oriented cut |
| Metal AM commentary | Order $6–7B class for 2026 metal-related cuts in some briefs | Not always comparable to full Wohlers |
| US defense AM budget request (trade citations) | ~$3.3B FY2026, large YoY increase reported | Demand pulse, not commercial market size |
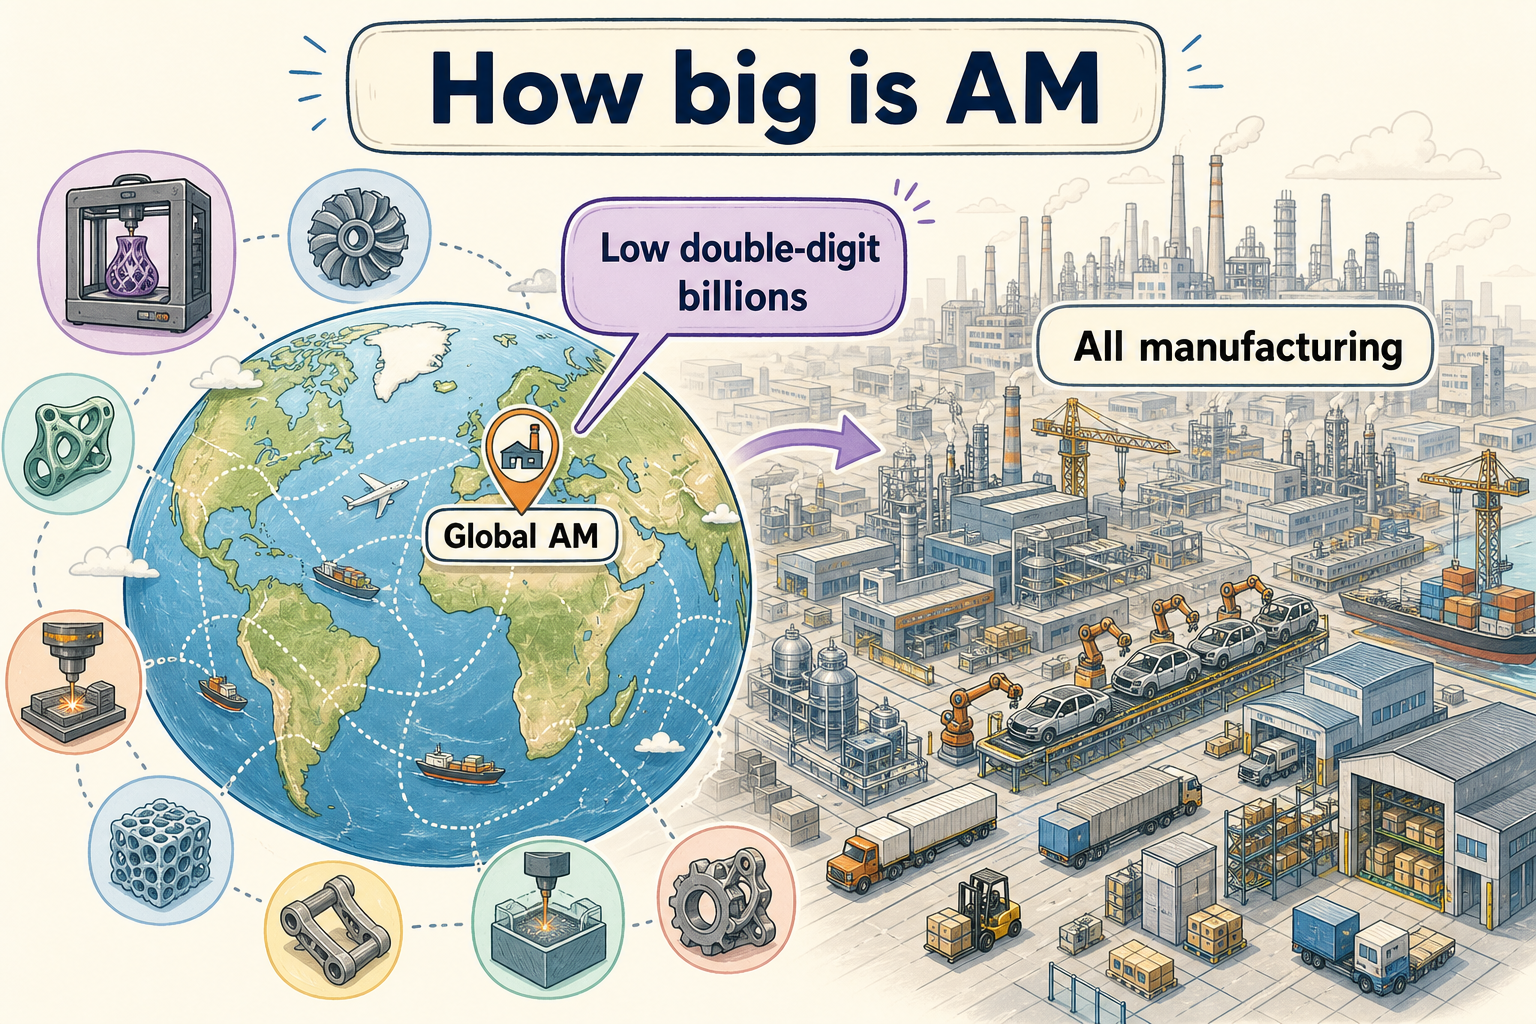
Decision-useful reading: AM is a low-double-digit-billion global industry growing roughly high single to low double digits annually—material, not moonshot hypergrowth, and not dead. Divergence of $12B vs $24B is usually definition, not fraud. Always ask: does the number include service bureaus and materials?
Unresolved: Full Wohlers table detail remains paywalled; citations above are second-hand and should be refreshed against the primary report before investment memos.
Trend classification (mandatory)

❓ Is AM still on an exponential curve?
Apply the Trend-analysis Rule carefully.
Metric candidates: industry revenue; machine price-performance (build rate per dollar); qualified alloys count; share of manufacturing value-add.
Industry revenue (full ecosystem): Best classified as logistic / maturing S-curve segment with ongoing expansion, not classic LOAR double-exponential. Growth near ~10% with expanding production use is healthy industrial growth, not “bits on a chip” compounding. Mechanism: learning curves, competition, and application discovery—but physical process rates, powder costs, and qualification prevent pure information-tech doubling every 18 months.
Machine capability (lasers per machine, monitored process control, desktop speed): Closer to stepwise + learning-curve improvements. Multi-laser PBF and high-speed FFF are discrete jumps with plateaus.
Share of global manufacturing: Still tiny (historically well under 1% of manufactured goods value in classic NIST-era framing; no evidence of a sudden majority shift by 2026). Classify as early industrial diffusion, not economy-wide replacement.
Bottlenecks that break naive exponential claims: thermal physics, powder cost, post-processing labor, certification half-life measured in years, and factory utilization.
Next paradigms that could re-steepen curves: reliable high-volume metal binder jetting or equivalent; radically cheaper powder; autonomous post-processing cells; AI-closed-loop first-time-right builds that collapse scrap and qualification cost.
Reach: Expect AM to keep taking specific high-value geometries and spares rather than “winning manufacturing.”
Break-even economics
❓ When is AM cheaper or better than molding and machining?
Classical pattern (still true in 2026, with shifting constants):
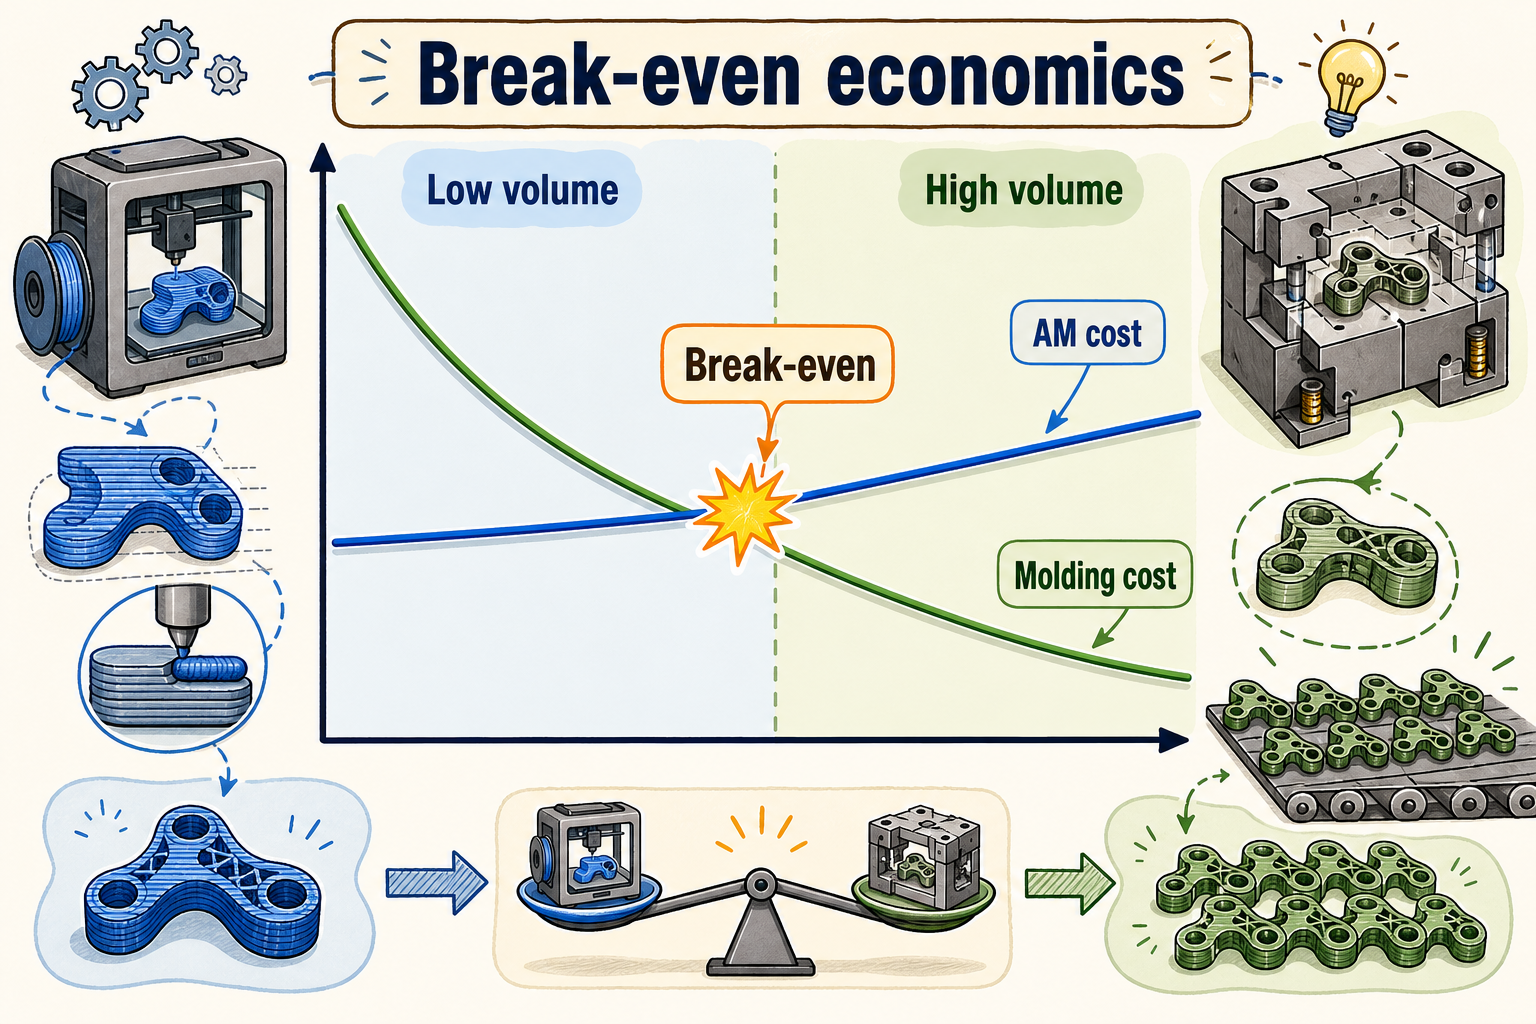
- Very low volume / high complexity / fast change: AM often wins on total cost and time.
- High volume simple parts: Injection molding and stamping crush AM on unit cost once tools are amortized.
- Break-even volumes are part-specific. Published examples still commonly show polymer AM competitive into hundreds or low thousands of units depending on geometry; metal AM break-evens are often far lower in unit count unless the design requires AM (internal channels, extreme consolidation) or the alternative is a multi-piece assembly with huge NRE.
Total cost of ownership must include:
- Tooling avoidance and redesign churn.
- Inventory carrying and obsolescence (digital spares).
- Buy-to-fly / scrap comparisons vs machining from billet.
- Qualification and quality system overhead.
- Post-processing and yield.
- Downtime avoided when a spare can be produced on demand.
NIST-era cost work already stressed that single-part cost models miss supply-chain effects. Aircraft spare parts are the canonical TCO win even when the printed unit looks “expensive.”
Hardware vs services vs materials vs software
❓ Which segment is the maturity tell?
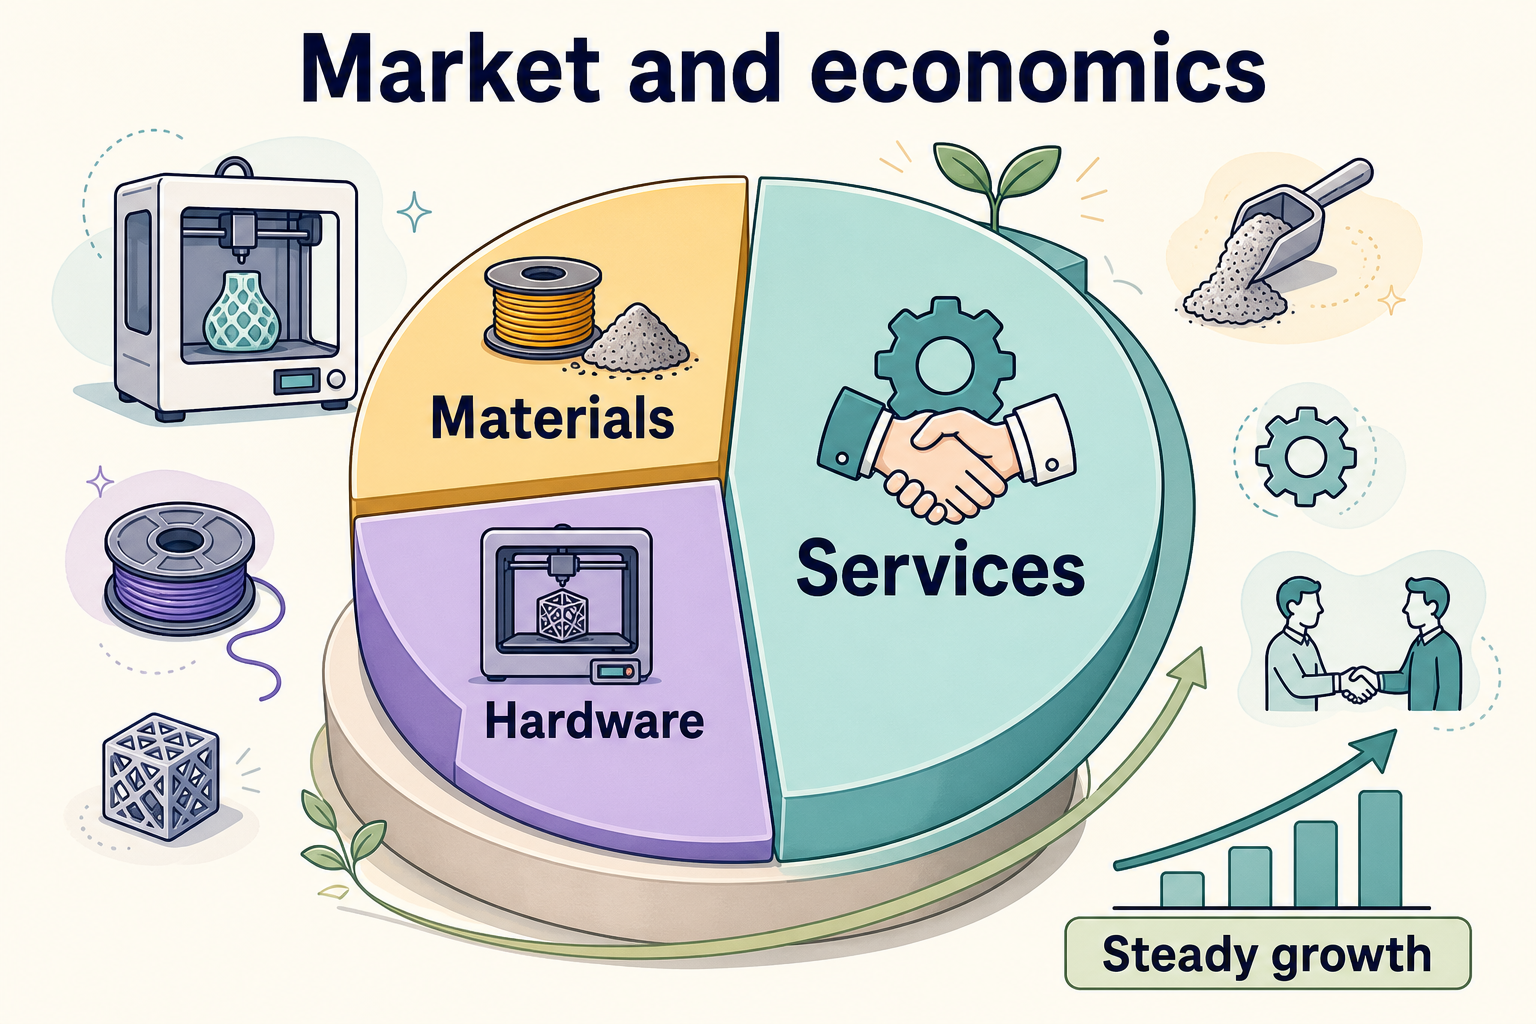
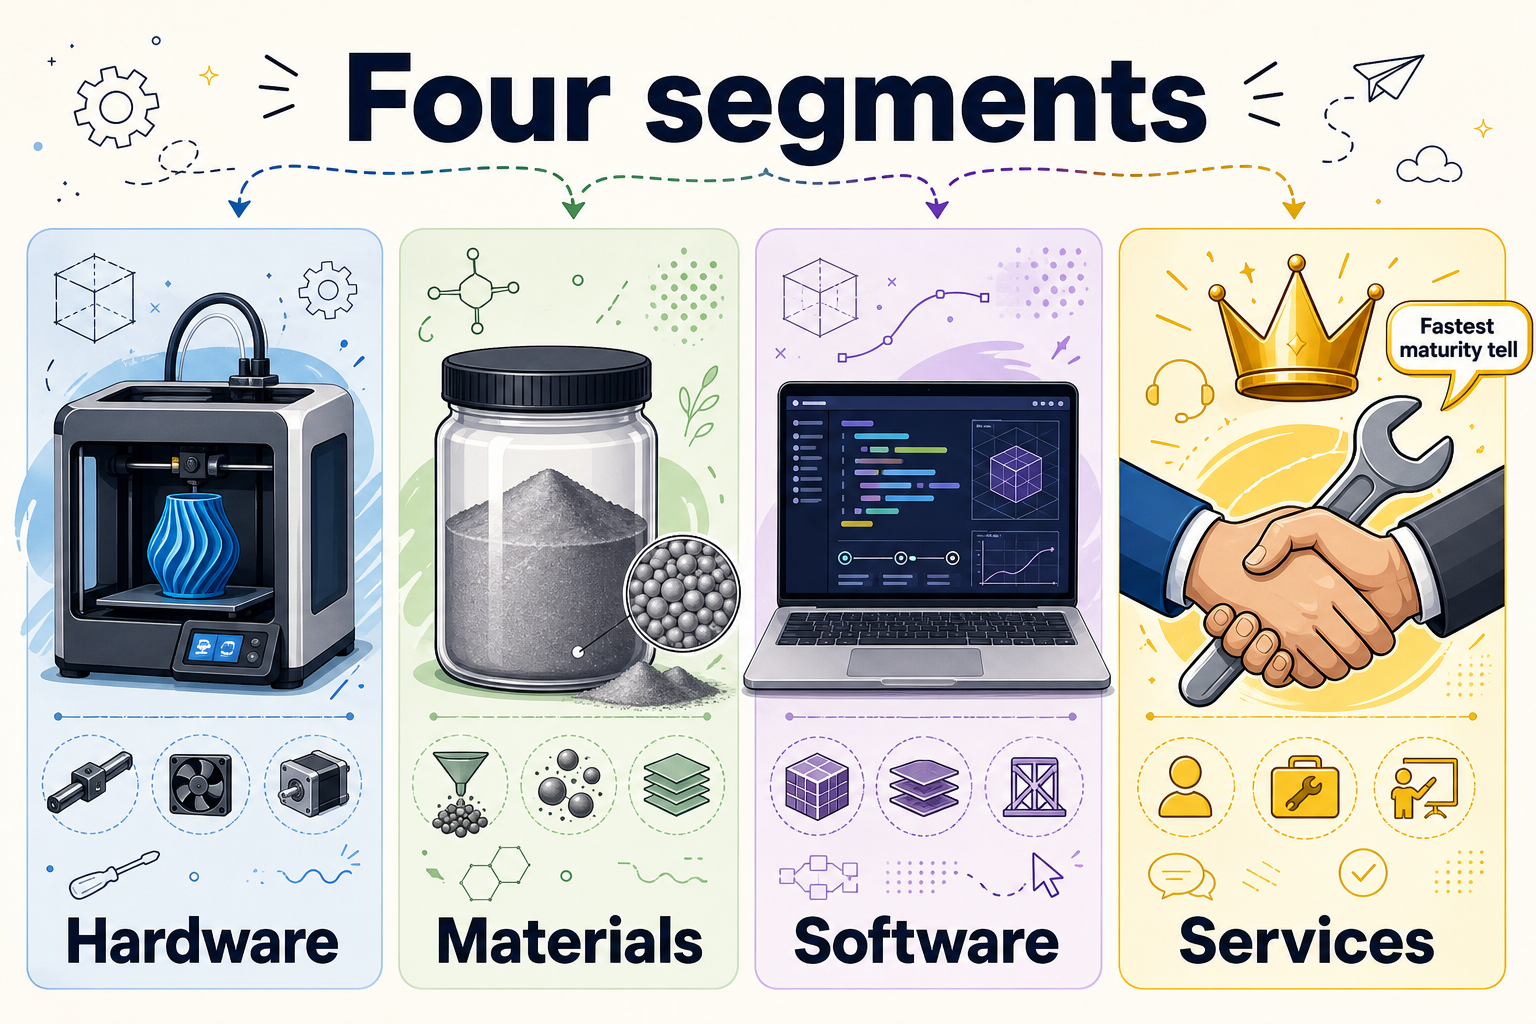
Trade coverage of Wohlers 2026-style findings stresses services outpacing hardware as a sign the industry is selling outcomes and capacity, not only boxes. Materials remain a high-margin recurring wedge for platform vendors. Software (MES, build prep, simulation, quality) is strategically hot because it encodes scarce process knowledge—and is the fastest-growing component in some AI-in-AM market cuts.
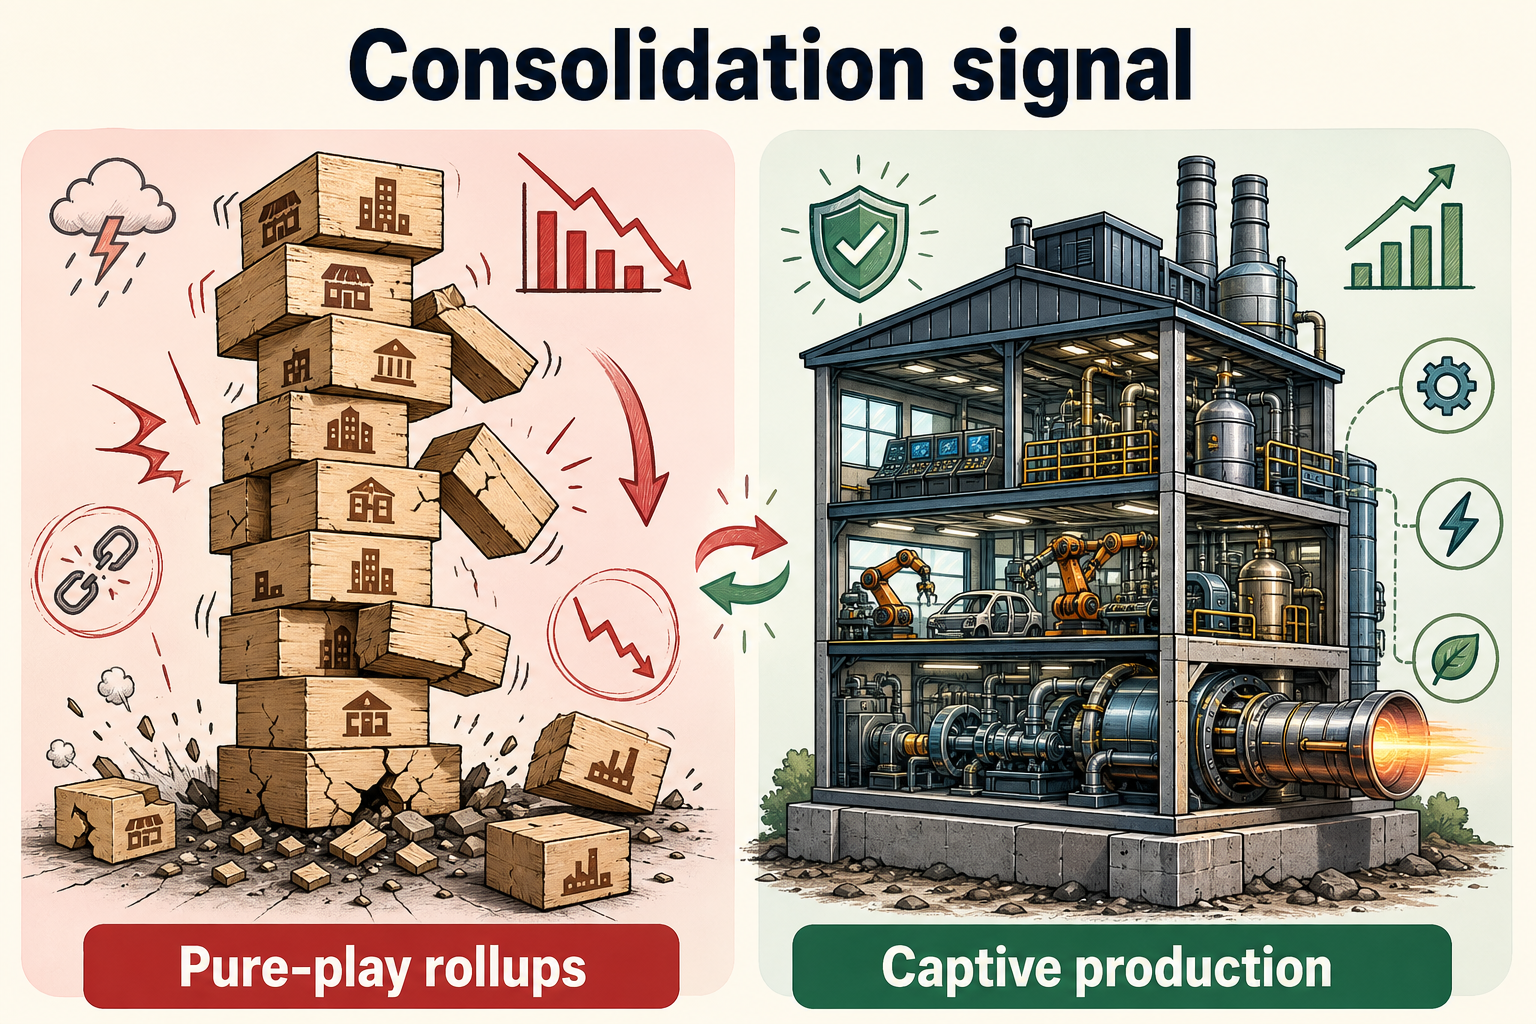
For pure-play public hardware vendors, 2021–2026 was often brutal: rates, slow industrial sales cycles, and overbuilt expectations. Captive users (GE Aerospace-type production) and diversified industrials capture much of the real value inside products (engines, implants), not as AM-equipment equity stories.
Corporate structure signal: consolidation and value destruction
❓ What does the Nano Dimension / Desktop Metal / Markforged saga say about the market?
Compressed timeline from company and trade reporting:
- Stratasys–Desktop Metal merger attempts earlier in the decade failed.
- Nano Dimension agreed to buy Desktop Metal (order ~$179M, closed April 2025 after Delaware litigation forcing completion).
- Desktop Metal’s independent board pursued bankruptcy reorganization (July 2025); core assets sold (Sep 2025) toward defense/energy-focused buyers (Arc Impact per trade press).
- Nano bought Markforged (~$116M, closed April 2025), then agreed to sell Markforged (ex metal binder-jet carve-out) to Stratasys for ~$42.5M (May 2026 announcement), with Markforged ~$70M 2025 revenue cited.
This is not “AM is fake.” It is “public-market pure-play rollups without disciplined unit economics are fake strategies.” The technology ships in GE plants and dental clinics while equity narratives thrash.