Research · Blind pairwise
Dataset & grading
Last updated: 2026-08-12
Inside the dataset and how grading works
❓ What is actually being tested, and who decides if the AI “won”?
Scale and structure
| Layer | v1 figure | Meaning |
|---|---|---|
| Sectors | 9 | U.S. industries each contributing >5% of GDP (Q2 2024 value-added basis cited by authors) |
| Occupations | 44 | Top wage occupations inside those sectors that are ≥60% digital/knowledge tasks on O*NET-style coding |
| Full task set | 1,320 | 30 tasks per occupation |
| Gold open set | 220 | 5 tasks per occupation; public prompts + files |
| Expert tenure | ~14 years average | Task authors; min 4 years, resume/interview/background filters |
| Human time per task | ~7 hours average (paper long-horizon bullet); gold-set mean 404 minutes (~6.7 h) in cost appendix | Self-reported, multi-reviewer validated |
| Economic wage mass | ~$3T / year for covered occupations (authors’ framing) | Not “GDPval score = $3T,” but scope weight |
Occupations include the kinds of roles leaders already recognize as expensive knowledge work: software developers, lawyers, registered nurses, mechanical engineers, and peers across the nine large sectors—not only “AI engineer” micro-niches.
How a task is built
- An experienced professional writes a realistic request (the prompt).
- They attach reference files (gold set: up to ~17 files; full set: up to ~38).
- They produce the gold deliverable—their own professional work product.
- Tasks are mapped back to O*NET work activities so coverage is not random pet projects.
- Each task goes through ~5 human expert reviews on average (minimum three), plus model-based screening.
- Dollar value proxies are estimated as completion hours × BLS median occupational wage.
Deliverable types are multi-modal on purpose: documents, slide decks, spreadsheets, diagrams, CAD-like design packages, media, support conversation artifacts, and more. That forces models to do file creation and formatting, not only chat text.
How winners are chosen
Primary metric: blinded pairwise comparison by occupation-matched experts.
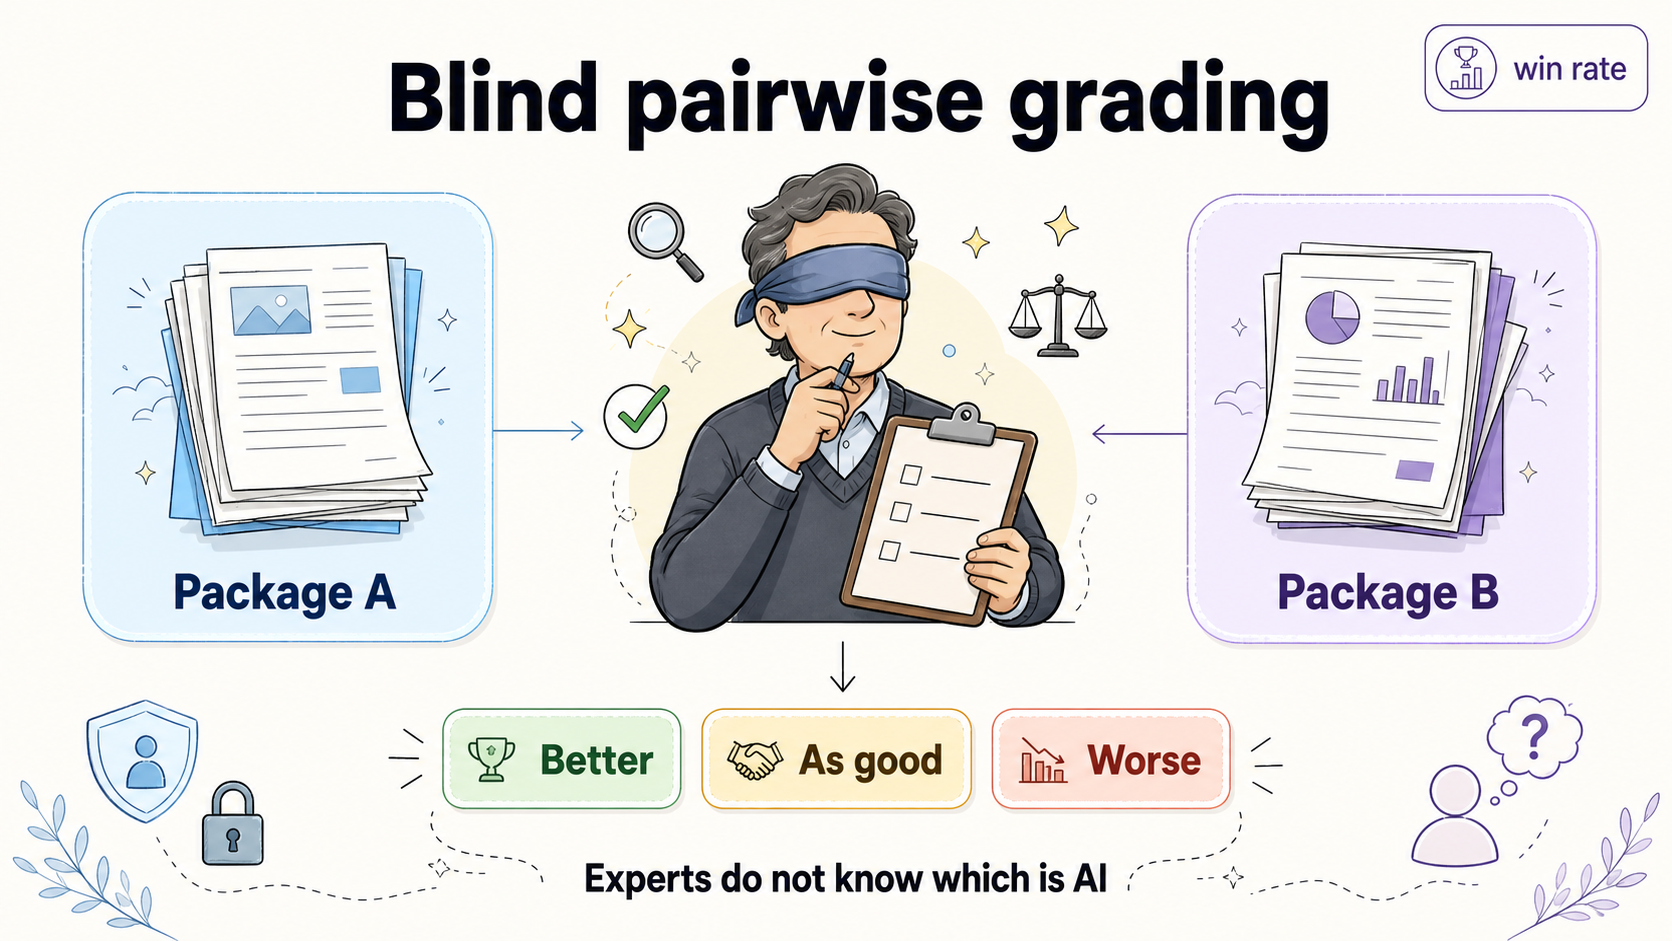
- Grader sees the request + references.
- Grader sees two deliverables (human gold vs model), without reliable labels.
- Grader ranks and classifies the model output as better / as good as / worse.
- Justifications are collected; clustering later explains why models lose.
Win rate w in the cost appendix is defined as how often the model deliverable is rated better than the human deliverable. Blog/paper headline quality figures also emphasize wins + ties (e.g., Claude Opus 4.1 at 47.6% better-or-equal on the gold set). Readers must not mix the two without care: Table 2’s economics use the stricter win-rate column (GPT-5 at 39.0%).
Grading is expensive and slow by design: >1 hour per comparison on average on the gold set. That human judgment cost is not a footnote—it becomes the \(RT\) term in the productivity math.
Automated grader (secondary)
OpenAI trained an experimental model grader for the gold set:
- Agreement with human experts: ~66%
- Human–human agreement: ~71%
- Gap: about 5 percentage points
Useful for cheap iteration; not a full substitute for the human pairwise protocol when making scientific claims about parity.
Blinding limits (honest)
Authors tried to scrub filenames and hide model IDs, but style leaks remain (em dashes, first-person voice, self-naming). Graders may sometimes guess which sample is which. That is a real measurement impurity, not fatal to the directional result, but it means win rates are not laboratory-pure.
Why win rate is the right shape of score
A percent-correct exam can hit 100% and stop teaching you anything. A win rate against a moving baseline can keep measuring progress after models pass today’s experts—by swapping the baseline to a stronger model later. That is why GDPval is built for a multi-year capability track, not a one-time marketing chart.