Last updated: 2026-09-15
End of 2026, part B — AI trends that have a metric
❓ Which AI curves are compounding with a measured rate, and which are just a louder press cycle?
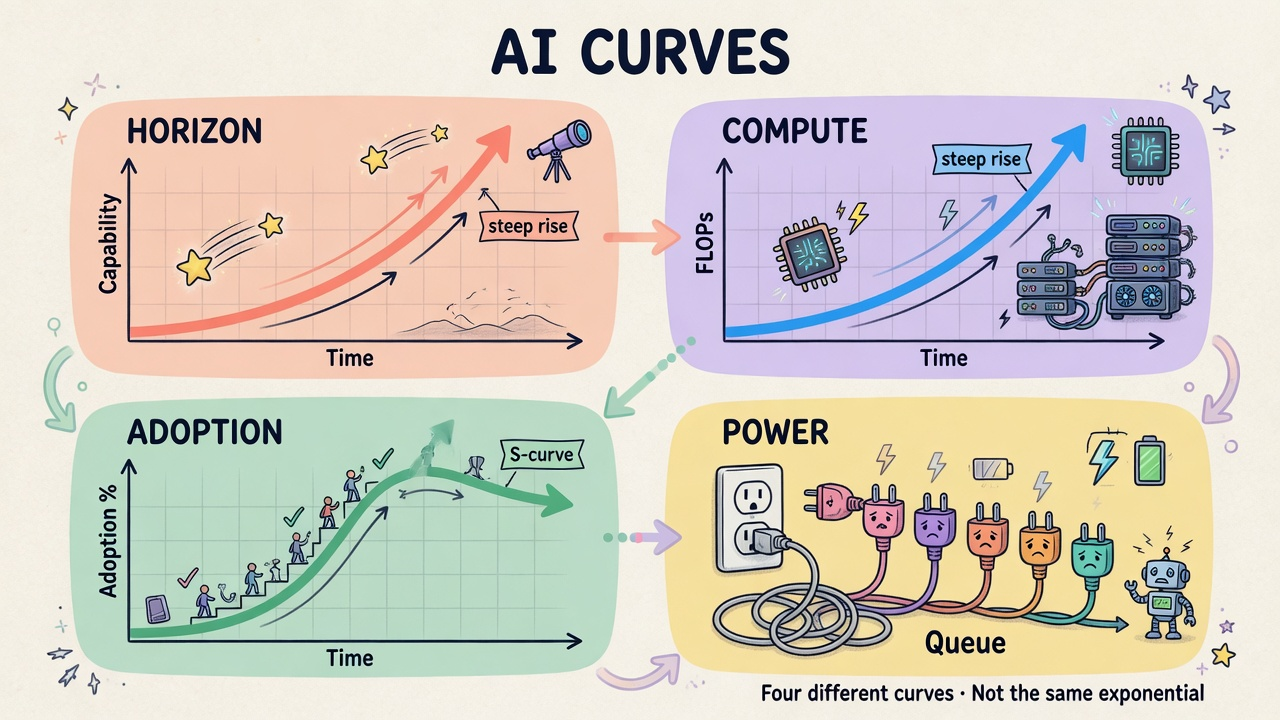
Apply the Trend-analysis Rule. Default hypothesis for information technology is Kurzweil’s Law of Accelerating Returns — but only when a stable metric, a window, a rate, and a mechanism are all present.
Live charts (external, refresh on load):
- METR time horizons, via Epoch: epoch.ai/benchmarks/metr-time-horizons
- Stanford AI Index 2026 hub: hai.stanford.edu/ai-index/2026-ai-index-report
- Artificial Analysis Intelligence Index: artificialanalysis.ai
The Epoch page is an interactive chart of the longest software-engineering-class task a model completes correctly more often than not, plotted against release date. That is the cleanest public picture of “how long can an agent work.” Open it live; do not treat a screenshot of one Tuesday as the series.
HAPPENED as a chart capture (15 Sep 2026): Epoch’s public METR time-horizon graph still plots through older 2026 names (around four-hour 50% horizons). It has not yet been an Astra/Fable 5.1 print. The shape is the point: seconds in 2019 toward hours in 2026, log scale.
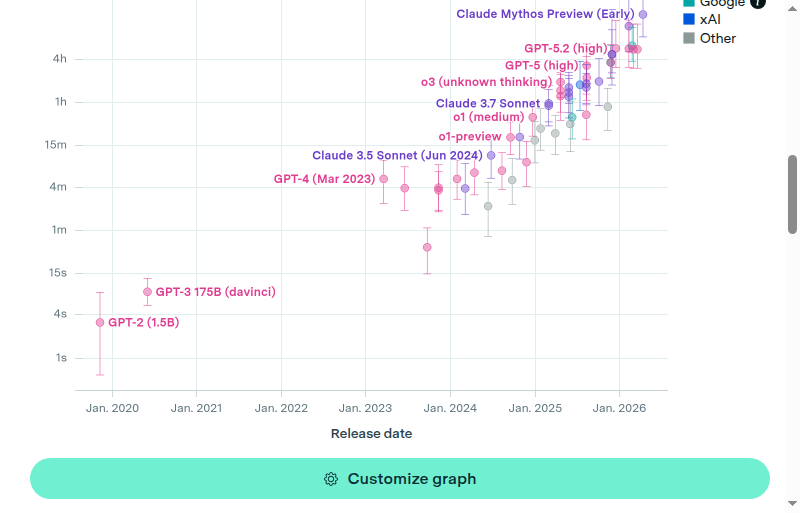
Source: epoch.ai/benchmarks/metr-time-horizons
Trend 1 — Agent task time horizon
❓ How long can a frontier agent work before it is more likely to fail than succeed?
MEASURED TREND: exponential (software-task 50% horizon), with a disputed recent rate.
- Metric: METR 50% time horizon — human duration of tasks the model completes at 50% success.
- Period: ~2019–2025/26 on HCAST / RE-Bench / SWAA-class suites; Time Horizon 1.1 published January 2026.
- Rate: Long-run doubling near 7 months (~2019–2024). Post-2024 fits in secondary analyses compress to ~3.5 months (~10×/year) or ~89–131 days depending on the slice. Epoch’s 16 April 2026 paper finds strong evidence of acceleration on log METR 50% horizon versus a 2023-onward linear trend, driven by reasoning models, but cannot pin a unique growth rate. (Epoch, 2026-04-16; Epoch METR page)
- Mechanism: Reinforcement learning on tool-using trajectories, test-time compute (reasoning tokens), better harnesses, and a larger stock of long tasks in TH 1.1 (8-hour+ tasks raised from 14 to 31, which un-flattens an earlier ceiling).
- Bottlenecks: The 80% horizon stays much shorter than the 50% horizon — occasional long success is not dependable long success. Domain transfer from software suites to bank judgement is limited. Human demonstration data for real workflows is scarce.
- Next paradigm: If RL’s share of training compute saturates, several analysts (Read the OOM, Feb 2026) PREDICT a return toward 7-month doubling in 2026–27. That slowdown is not yet a measurement for year-end 2026.
- Reach: A workday-length 50% horizon is a PREDICTION some writers attach to 2027; it is not on the September 2026 print.
Classification: Exponential on the 50% software horizon. Not double-exponential unless the rate itself keeps accelerating — Epoch explicitly refuses a unique super-linear fit.
Secondary commentary in September 2026 still quotes Claude Opus 4.5 at ~320 minutes (5+ hours) 50% horizon. That figure is stale relative to Fable 5.1 / Astra and should not be treated as the current frontier print. Unresolved: METR’s own latest public TH 1.1 row for Astra/Fable.
Trend 2 — Training compute and investment
❓ Is the money and the FLOP still compounding, or has the story moved to power?
MEASURED TREND: exponential in frontier training compute; stepwise/hype-led in dollar investment.
- Metric (compute): Frontier training compute, H100-equivalents. Epoch: ~5× per year since ~2020. Stanford AI Index: global AI compute capacity grew 3.3× per year since 2022, to 17.1 million H100-equivalents; Nvidia >60% of that compute. (AI Index R&D chapter)
- Metric (dollars, 2025 window): Global corporate AI investment $581.7B, +130% YoY; generative AI $170.9B, nearly 5×. US private AI investment $285.9B versus China $12.4B in the Index’s private-investment lens — a comparison the Index itself warns understates Chinese state funds.
- Mechanism: Bigger clusters, denser chips, and (separately) post-training RL. Positive feedback: better models write more of the next model’s code (Anthropic: >80% of merged code authored by Claude as of May 2026 — a HAPPENED coding-share claim, not recursive self-improvement of weights).
- Bottlenecks: Power, transformers (lead times 48–60 months at major OEMs in 2026 commentary), local moratoriums, and HBM/interconnect. SemiAnalysis and Morgan Stanley treat electrons and permits, not GPUs, as the 2027 binder — those are PREDICTION and live in chapter 06.
- Reach: A 5×/year compute trend can continue on paper while deployable inference in a given grid does not.
Classification: Compute — exponential over 2022–2025. Dollar investment — too short a window and too accounting-dependent to call exponential; treat 2025’s +130% as a step.
Trend 3 — Adoption and the US–China score gap
❓ Did capability plateau, and did China close?
HAPPENED (AI Index 2026, 2025 data, released April 2026):
- Industry produced >90% of notable frontier models in 2025.
- Organizational AI adoption 88% (from 78%).
- Generative AI reached 53% population adoption in three years — faster than PC or internet diffusion in the Index’s telling. US population adoption ranks 24th at 28.3%; Singapore 61%.
- US and Chinese models traded the lead several times from early 2025. DeepSeek-R1 matched the top US model in February 2025; as of March 2026 Anthropic’s top model led by 2.7%. US still produced more notable models (59 vs 35) and higher-impact patents; China led publications, citations, patent counts, and industrial robot installs.
- Foundation Model Transparency Index average 40, down from 58. The most capable models disclose the least.
- AI datacentre power 29.6 GW; US hosts 5,427 datacentres, more than 10× any other country; TSMC fabricates almost every leading AI chip. Grok 4 training emissions estimated 72,816 tCO₂e.
Classification: Adoption — logistic/S-curve beginning, not exponential forever. US–China score gap — stepwise closure, not a law. Transparency — linear decline, a governance trend, not a capability trend.
Peak data: The Index and follow-on commentary flag high-quality public text exhaustion as a concern for 2026–2032. That is a WARNING / PREDICTION about a bottleneck, not a measured “we ran out on date X.”
Trend 4 — Price split: $10/$50 frontier versus cache and Flash
❓ Is intelligence getting cheaper, or only the workhorse?
HAPPENED: Astra and Fable 5.1 list at $10 / $50 per million. Fable cache-read ~$0.25; Astra cache-read $1. AA places every Astra reasoning effort on the Intelligence-vs-cost frontier; at max, Astra matches Fable’s 53 at ~40% the cost per task because it emits far fewer tokens.
MEASURED TREND (inference at fixed quality): Epoch and others have long documented falling cost at a fixed capability level. That can coexist with rising list prices for the new frontier. LeCun’s June 2026 warning that prices are rising faster than run-cost is falling is a take about unit economics (VivaTech / CNBC coverage).
Classification: Cost-at-fixed-quality — historically exponential decline. Frontier list price — stepwise up in this window. Agent workloads are a cache and output-token problem, not an “Intelligence Index points” problem.
Trend 5 — Power demand (measured past, predicted future)
❓ Has electricity already become the story, or is that 2027 talking?
HAPPENED / MEASURED: UNECE, 8 September 2026, citing IEA: datacentre consumption from 485 TWh (2025) to a PREDICTION of 950 TWh (2030), ~3% of global demand. Investment in datacentre infrastructure is forecast to merely double by 2050. Ireland and the Netherlands already restrict connections. (UN News)
AI Index 29.6 GW is the 2025-capacity print. The 2027 “grid goes negative / break ground by October 2026” material is PREDICTION and belongs in chapter 06.
Classification: Datacentre TWh — exponential-looking in the IEA 2025–2030 forecast, but the forecast is not a measurement. 2025 capacity is a point.
Why this is a good explanation
The September 2026 feeling of “everything at once” is not one exponential. It is at least four different curves sharing a press cycle: (1) 50% time horizon compounding, (2) compute compounding, (3) adoption going logistic, (4) power going from abundant to queued. You cannot swap “benchmarks went up” for “the grid queued 5–7 years” and still explain why a CFO and a lab safety lead are having different years.